- 13
- February
Waterloo Region Technology Marketing Spotlight
Welcome!
And thanks for taking an interest in this project! I hope you learn as much from reading this report as I did preparing it.
As I said at the outset, my aim is to produce a report that provides us all—the technology marketers and company leaders of the Waterloo Region, and perhaps beyond—with common understanding of shared issues, priorities, challenges, concerns, and more.
At the very least, I hope to spur productive discussions, but my ultimate goal is to help to advance our region’s tech marketing effectiveness by bringing tough subjects to the fore.
Why? Because without effective marketing, the ceiling above us is artificially low, and we can’t let that happen. We need to give our world-changing, life-saving, innovative, powerful, amazing things a fighting chance in the market!
Because the purpose of business is to create a customer, the business enterprise has two—and only two—basic functions: marketing and innovation. Marketing and innovation produce results; all the rest are costs. Marketing is the distinguishing, unique function of the business.
—Peter Drucker
I’d like to thank everyone who participated in and supported the survey component—there’s really no substitute for the genuine insights you shared, and your commentary brings the data to life. And thanks also to the fine folks who proofread the early draft!
—Lee Brooks, Cromulent Marketing
Click here to download the report in PDF
Table of Contents
- TL;DR
- Where Do We Work?
- Who Are We?
- What Do We Do?
- The Basics: Objectives, Strategies, and Tactics
- Much Ado About Messaging
- Sales Enablement, For the Win!
- C-O-N-T-E-N-T (Find Out What it Means to…Us)
- Methodology
Marketing is a battle of perceptions, not products. All that exists in the world of marketing are perceptions in the minds of the customer or prospect. The perception is the reality. Everything else is an illusion.
—Al Ries & Jack Trout, in The 22 Immutable Laws of Marketing
TL;DR
This report shines a light on the Waterloo Region technology scene, in general, and on technology marketing, in particular.
We combine a comprehensive top-down study of publicly available company information with a bottom-up survey of technology marketers to shine a spotlight on the region’s tech ecosystem and the people who call it home.
The resulting insights, while not always surprising, are nonetheless instructive.
The Ecosystem
While Waterloo Region’s tech companies participate in no fewer than 66 industries, a baker’s dozen form the foundation of our economy: these 13 appear in the lists of top 20 industries both by number of companies, and by number of employees.
While attention is lavished upon start-ups, fewer than 10% of tech employees work for a company that hasn’t yet celebrated its fifth birthday; in contrast, more than 50% work for a company founded before 2002—even ignoring OpenText and BlackBerry.
Statistically speaking, Waterloo Region’s scale-ups should be bigger: they seem to hit barriers at roughly the 200-, 250-, 500-, and 1000-employee marks. More investigation is needed to learn whether this observation is an anomaly or a sign of some deeper challenge.
The People
Marketers make up 4.2% of the tech workforce of Waterloo Region-based tech companies, but that average hides enormous variation. On one end of the spectrum, some relatively large companies devote as much a 17% of their headcount to marketing. On the opposite end, and somewhat alarmingly, a large number of companies seemingly don’t have any dedicated marketing resources at all—including companies with more than 50 employees.
Most early stage technology companies can’t afford a full-time marketer, but need marketing to fuel their scaling efforts; without something to fill the gap, scaling is slower and less efficient.
We discuss this challenge in Minding the Gap.
Only 15% of survey respondents have accrued 15 or more years of experience, but there’s a large cohort of younger marketers joining the ranks.
When it comes to getting organized and directing our efforts, the survey reveals that understanding of objectives, strategies, and tactics declines significantly as we move down the organizational hierarchy. Consequently, Executives should regularly circle back with their teams to make sure objectives and strategies, in particular, are well-understood.
On a related note, Middle Managers and Individual Team Members reported that Changing priorities is the most frequent challenge they face.
Enabling greater sales effectiveness is the most challenging marketing objective; the most significant sales enablement challenge is Creating differentiation versus alternatives. One major contributing factor is relatively poor bottom-of-funnel content, in general, and a significant dearth of technical content, in particular—both of which are clear findings.
Where do we work?
Let’s start by exploring the companies that make up the local technology ecosystem, including their industries, employment impact, and scaling characteristics.
The Industrial Evolution
The Waterloo Region is renowned as a hotbed for innovation and entrepreneurship, but what’s often missed in this characterization is the sheer diversity of the companies that make their home here.
Even if we limit ourselves to LinkedIn’s restrictive category list, we still find that the region’s tech companies participate in no fewer than 66 industries.
Are our market-specific commitments sufficiently focused and intense to win market power? Are we winning fast enough? Do we have a clear line of sight to our growth opportunities in adjacent market segments?
—Geoffrey Moore, in Escape Velocity
The top 20 industries—led by the ambiguously unhelpful Information Technology & Services and Computer Software, with Medical Devices and Marketing & Advertising close behind—account for roughly two-thirds of all the region’s tech companies.

While the top 20 make up a diverse range, the long tail tells the story more fully. It includes at least 46 additional industries, many of which only contain one or two local companies.
The long tail includes (presented in alphabetical order):
- Accounting
- Airlines/Aviation
- Apparel & Fashion
- Aviation & Aerospace
- Civic & Social Organization
- Civil Engineering
- Computer Games
- Computer Networking
- Consumer Goods
- Consumer Services
- Education Management
- Entertainment
- Events Services
- Facilities Services
- Farming
- Food & Beverages
- Food Production
- Fundraising
- Furniture
- Gambling & Casinos
- Government Administration
- Higher Education
- Information Services
- Insurance
- Leisure & Travel
- Logistics & Supply Chain
- Machinery
- Maritime
- Mechanical or Industrial Engineering
- Media Production
- Mental Health Care
- Music
- Nonprofit Organization Management
- Online Media
- Package/Freight Delivery
- Pharmaceuticals
- Real Estate
- Renewables & Environment
- Research
- Restaurants
- Sporting Goods
- Sports
- Transportation/Trucking/Railroad
- Utilities
- Wireless
- Writing & Editing
Takin’ Care of Business (TCB)
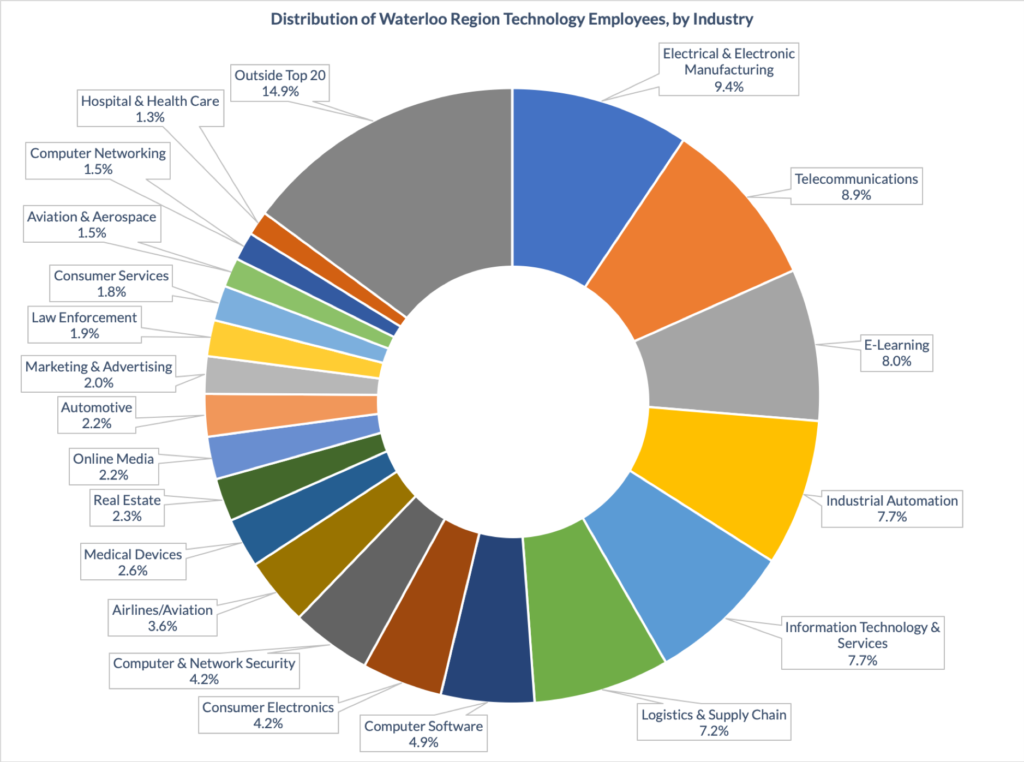
When we look at industries by employee count, a somewhat different picture emerges:
- First, we no longer have a truly dominant sector;
- Second, the rank order of industries has changed substantially; and
- Third, the relative drop from position-to-position is much lower
Economic Drivers
13 industries rank in the top 20 by both company count and employee count. Because they’re home to quite a few companies, each of which has quite a few employees, these industries are vital for the region’s economic stability.
| Industry (Alphabetical) | Rank by Employee Count | Rank by Company Count | Mean Number of Employees per Company |
| Automotive | 14 | 7 | 30 |
| Computer & Network Security | 9 | 15 | 84 |
| Computer Software | 7 | 2 | 37 |
| Consumer Electronics | 8 | 6 | 46 |
| E-Learning | 3 | 16 | 159 |
| Electrical & Electronic Manufacturing | 1 | 10 | 125 |
| Hospital & Health Care | 20 | 11 | 19 |
| Industrial Automation | 4 | 5 | 84 |
| Information Technology & Services | 5 | 1 | 26 |
| Law Enforcement | 16 | 20 | 57 |
| Marketing & Advertising | 15 | 4 | 18 |
| Medical Devices | 11 | 3 | 24 |
| Telecommunications | 2 | 12 | 134 |
The Age of Majority
Start-ups get lots of attention: they’re new, exciting, and boast the allure of potential.
But in terms of employment, young companies account for a relatively small fraction of the tech workforce. The figure below shows the percentage of tech employees who work at a company founded before a particular year.
A quick glance shows that more than half of the region’s tech employees work for a company founded before 2002. Moreover, fewer than 10% work for a company that hasn’t yet celebrated its fifth birthday.
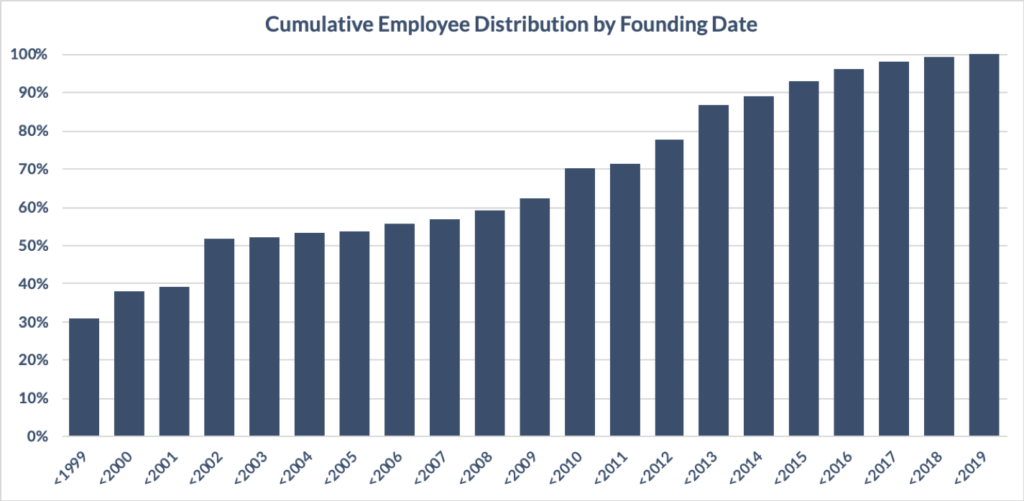
Diving deeper shows us that older organizations employ substantially more people, per- company. There are two factors at work: first, they’ve had time to grow; second, there’s a survivor bias—only successful companies survived to be included in this report.
While this observation isn’t surprising, the particulars are, nevertheless, remarkable.
One of the most dangerous outcomes for a startup is to bumble along in the land of the living dead.
—Eric Ries, in The Lean Startup
Start-ups…as far as the eye can see!
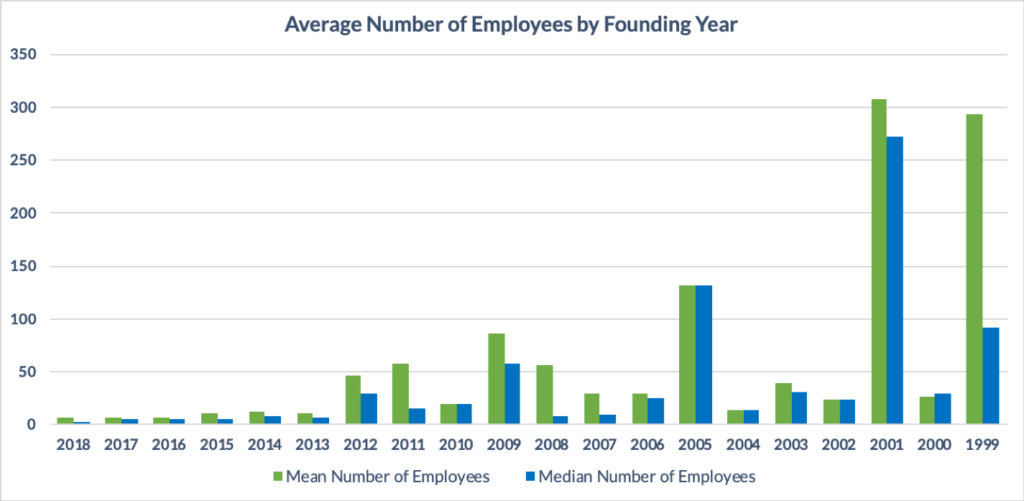
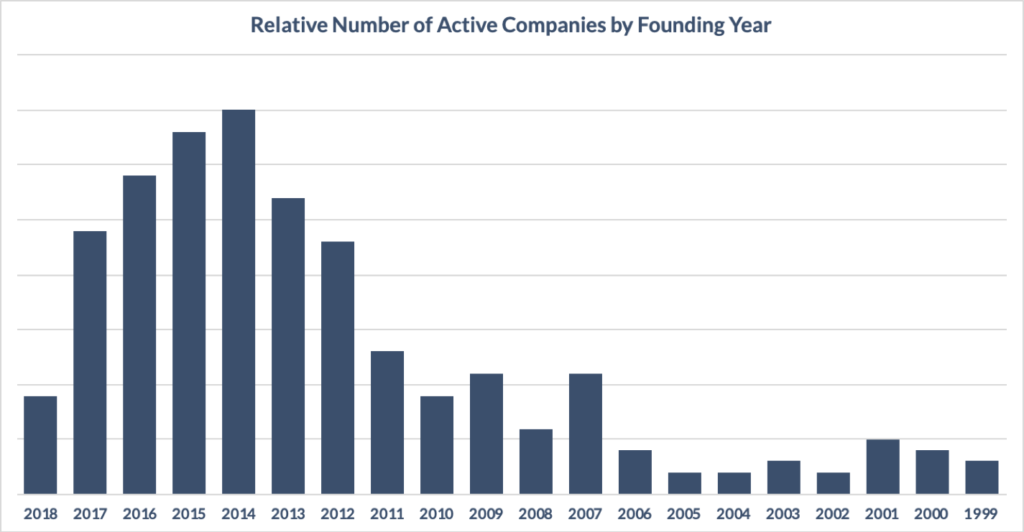
Another reason why start-ups dominate headlines is that they’re plentiful. This fact becomes abundantly clear when we plot the relative number of companies by founding year.
Unfortunately, without historical records of the number of companies started in a given year, we can’t say much more. Is the relative dearth of companies on the right side due to low survival rates? Or maybe low start-up rates at points in the past (perhaps following the dotcom crash)? It’s likely that a combination of factors is at play.
Statistically speaking, Waterloo Region’s scale-ups should be larger: they seem to hit barriers at approximately the 200-, 250-, 500-, and 1000-employee marks.
We explore this peculiar phenomenon in Growing Pains.
Who Are We?
We wanted to understand how experiences, responsibilities, perspectives, and opinions differ based upon a respondent’s role within the organization—so we asked participants to indicate which of three labels best characterize their position: Executive, Middle Manager, or Individual Team Member?
Throughout the remainder of this report, we’ll compare and contrast responses from these three groups, so let’s get to know them a bit:
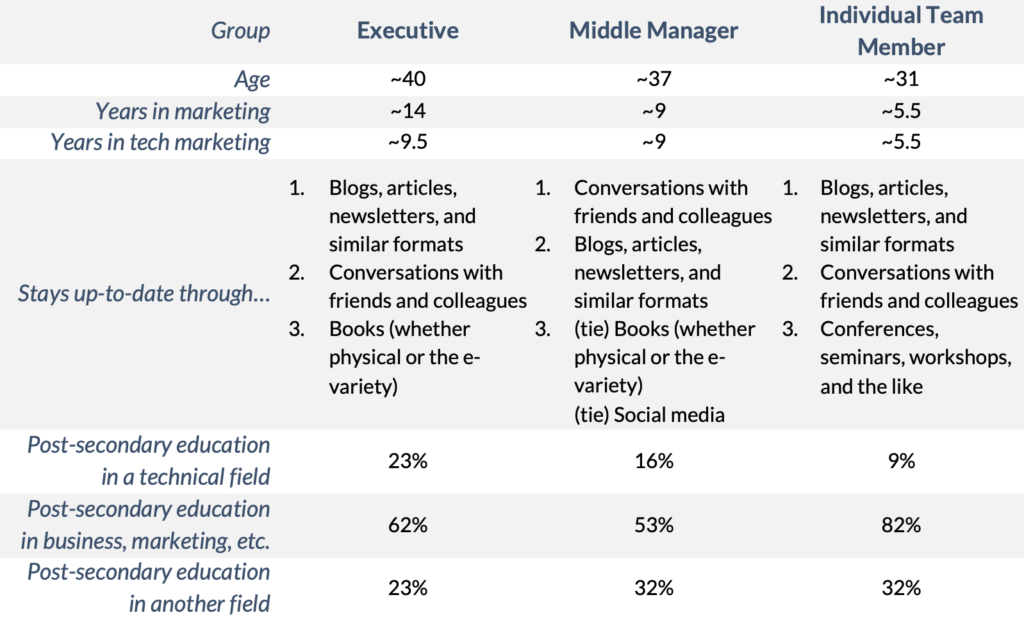
Almost three quarters of survey respondents are between 26 and 45 years of age, with the average age landing in the early-to-mid thirties; roughly 15% are 46 or older, while a little under 12% are 25 or younger.
Just over 20% of the region’s technology marketers have more than 15 years of experience in marketing (in any field), with a relatively large population of less experienced marketers coming up through the ranks.
When we narrow our focus to technology marketing, the picture looks a little different, but the story is similar: with this restriction applied, only 15% of respondents have accrued 15 or more years of experience.
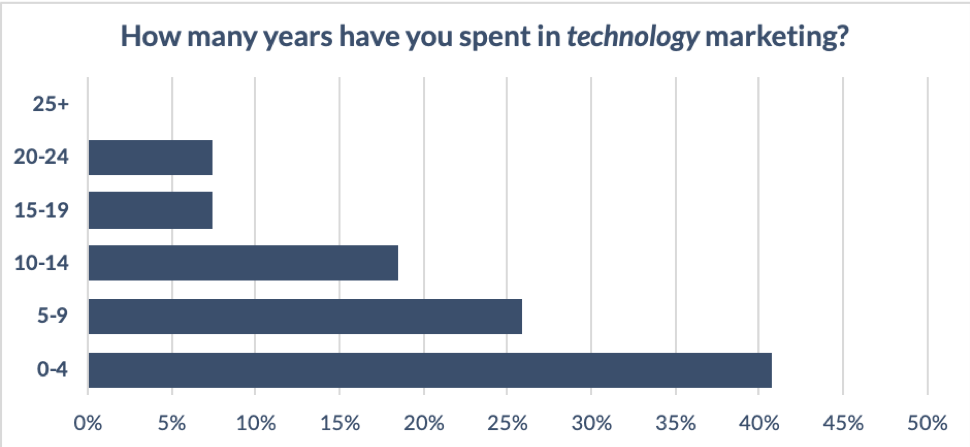
Moreover, the data shows that while many marketers enter the technology sector very early in their careers, some experienced marketers made the switch later, from other fields.
This development bodes well for the region, as drawing in senior marketers lets us learn from their experiences. Hopefully, these lessons serve as effective counterweights to the widespread misconception that everything in tech is brand new and needs to be invented.
We Are (sometimes) Legion
Building an effective marketing team should be a priority for every organization. But how much of an organization’s headcount should marketing represent? The answer is subjective and variable, and depends on all sorts of factors; what we can do, however, is provide some benchmarks about what’s happening in the real world.
In the Waterloo Region, marketers make up 4.2% of the tech workforce, but:
- Smaller companies have proportionally larger marketing teams
- The 51-200 range is heavily influenced by eight companies who each devote 11% to 17% of headcount to marketing
- The 2-10 and 11-50 ranges are enormously variable
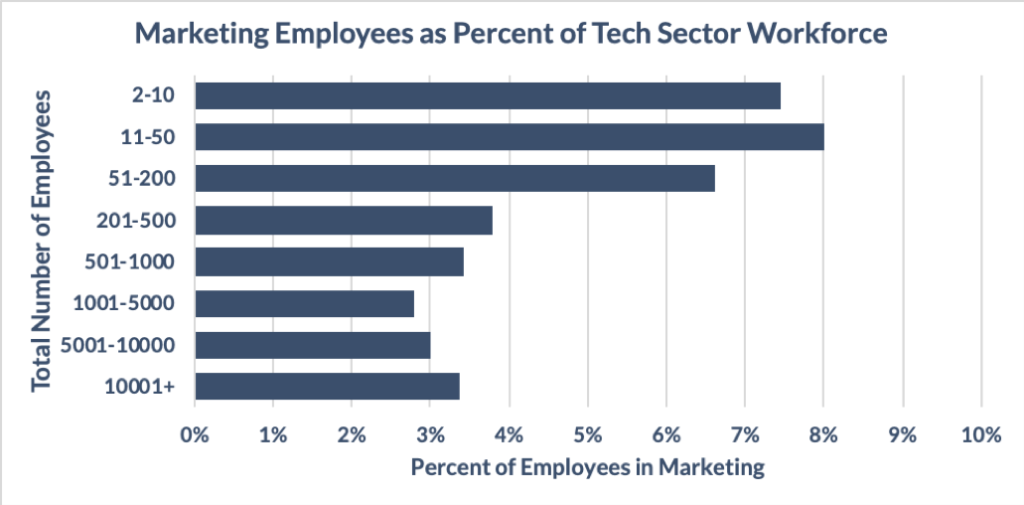
Alarmingly, a large number of companies seemingly don’t have any dedicated marketing resources (at all). While some of these companies are relying on agencies and consultants, and others are dividing marketing activities across the team, the suspicion is that many aren’t really ‘doing’ marketing in any meaningful capacity.
“When should I hire marketing people?”
We get asked this question a lot: here are our thoughts on the matter.
What Do We Do?
Broadly speaking, marketers fulfill two crucial functions. As experts in our target markets…
- We bring intelligence into the organization to inform requirements, competitive strategies, long-term growth initiatives, and other important decisions
- We apply that knowledge to take our solutions into the market effectively, to reach and create demand within prospects who are looking to solve problems
In overly simple terms: we bring market information in, and we take solution information out. In the real world, these activities divide into a range of job functions.
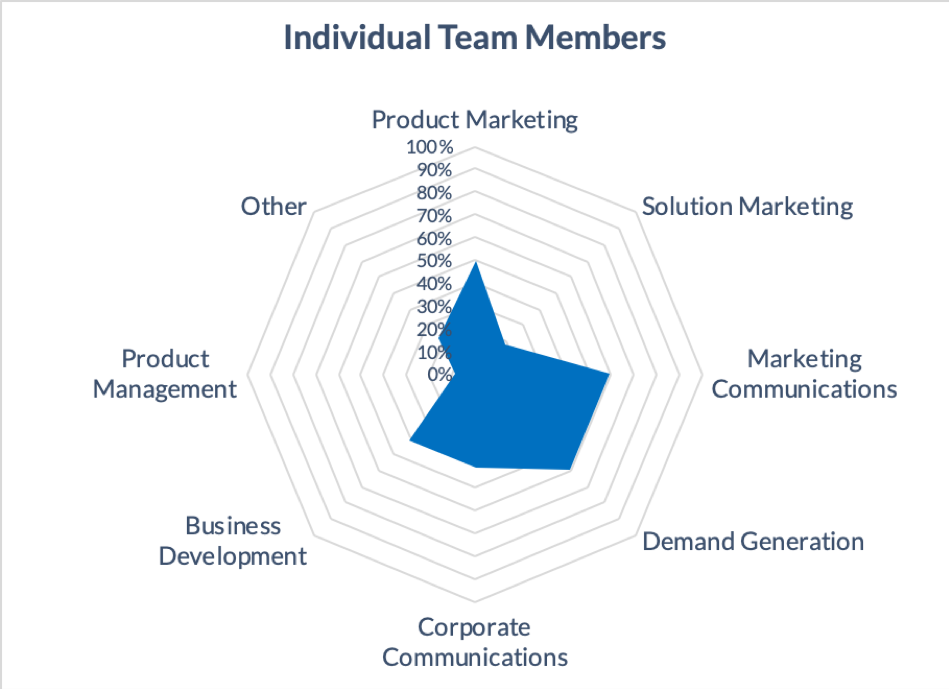
The radar charts indicate the percentage of respondents within a group who indicated that they perform, manage, or ultimately oversee a particular function.

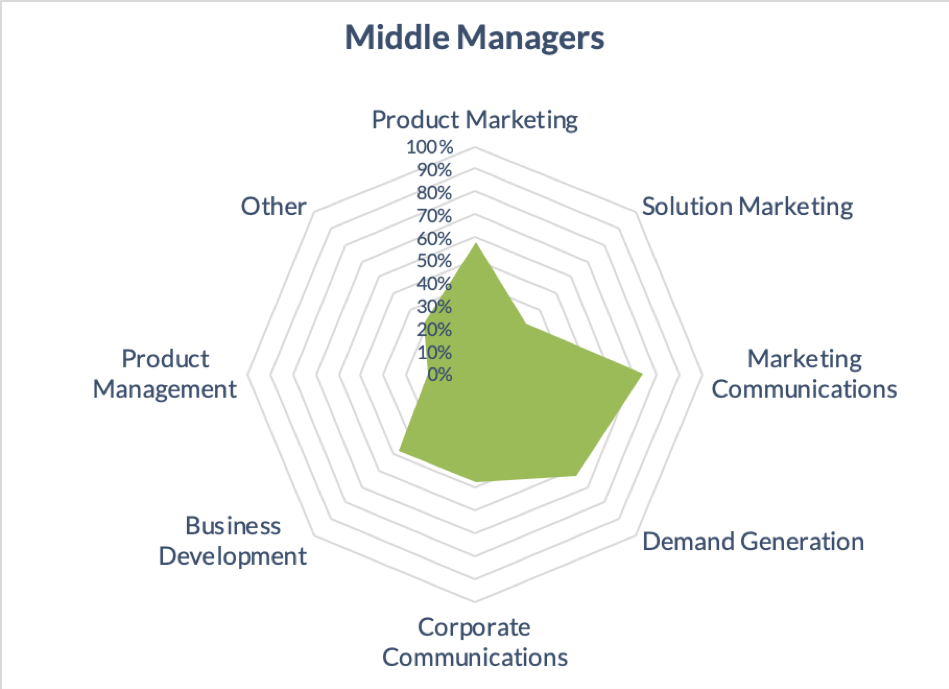
It’s clear that Executive scope is, on average, much broader than the other groups—which should surprise precisely no one. Specifically, the largest functional differences are that Executives are much more likely than other groups to be involved with Solution Marketing and Corporate Communications.
Middle Managers and Individual Team Members share a significant amount of functional similarity, with the main difference being that the former group has a higher likelihood of involvement with most functions.
Notably, both Individual Team Members and Middle Managers are much more likely to be involved with Business Development than are the Executives.
About 25% of respondents indicated other responsibilities, including Competitive Intelligence, Channel and Partner Marketing, Systems Development, and Proposal Management.
The Basics: Objectives, Strategies, and Tactics
Any significant act of leadership has three parts:
- First, clearly define the objective, to provide the team with a common purpose
- Second, determine the strategies by which you’ll achieve your objective—it’s critically important that every part of every strategy is dedicated towards achieving the objective, as each and every distraction lessens your chance of success
- Third, select and employ tactics that enhance and implement the strategy
Following this ‘order of operations’ determines whether you’re being productive, or just busy; unfortunately, as organizations grow, it’s challenging to get everyone aligned.
To quantify the challenge, we asked survey participants how well they understand their respective companies’ objectives, strategies, and tactics.
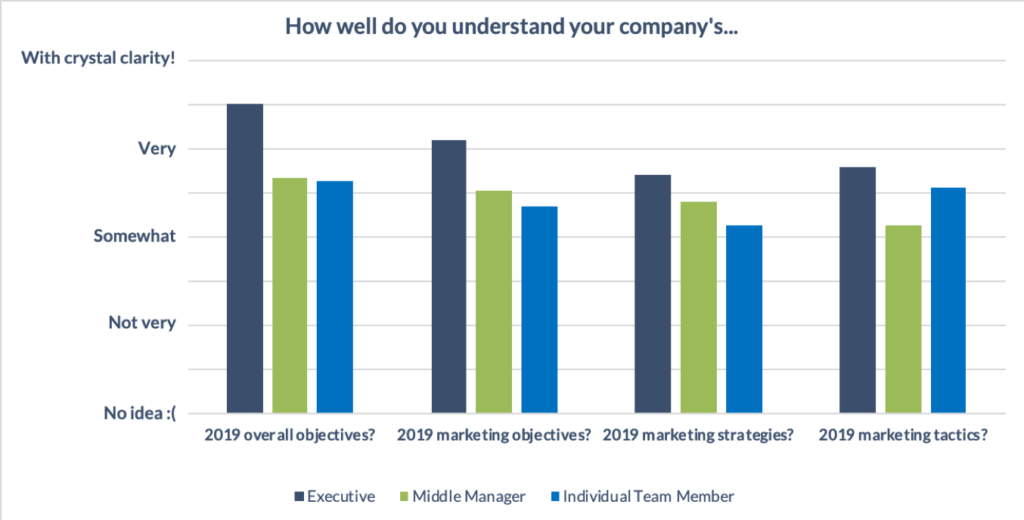
Executives indicated the highest confidence in their understanding of everything—overall objectives, marketing objectives, marketing strategies, and marketing tactics.
For the most part, comprehension declines as we move down the org chart, with one exception: Individual Team Members are confident they understand their organization’s marketing tactics quite well—essentially to the same level as they understand the organization’s overall objectives.
Interestingly, the larger the scope, the bigger the separation between the Executives’ reported level of understanding and that of the next group: that is, the largest separation is for overall objectives, the second-largest is for marketing objectives, the third-largest for marketing strategies, and the smallest for marketing tactics.
These responses suggest a clear takeaway for executives: check in periodically with your teams to make sure objectives and strategies are clearly understood.
Next, we wanted to understand the extent played by Executives, Middle Managers, and Individual Team Members in determining company activities.
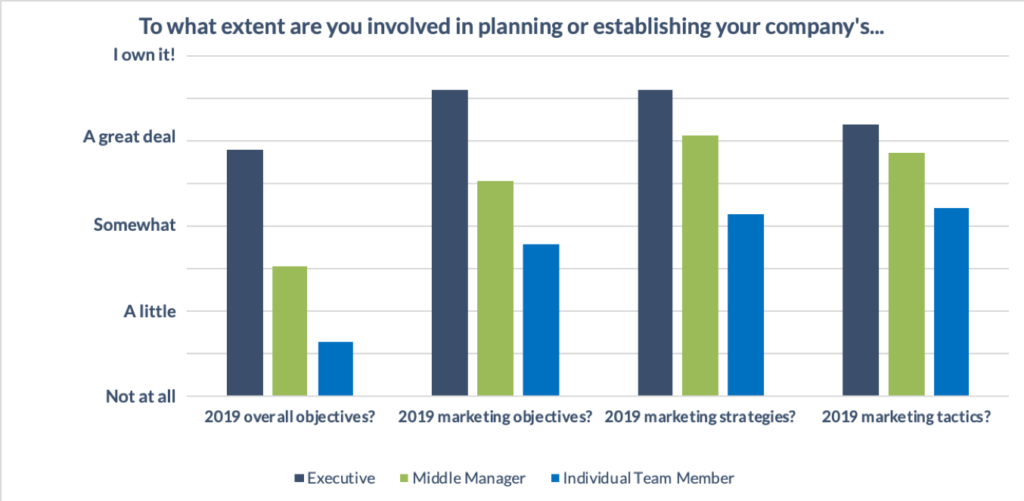
Of the three groups, Executives play the largest role in contributing to overall company objectives, averaging roughly “a great deal”. Executives play an even larger role in marketing objectives, which makes sense: while marketing executives contribute to overall objectives, they basically own the marketing domain. Executives also report owning the marketing strategies, which again isn’t shocking.
Middle Managers report little involvement in establishing overall objectives, significantly higher contributions to marketing objectives, and a great deal of involvement in planning marketing strategies; similarly, they report a great deal of involvement in marketing tactics.
Individual Team Members have barely any involvement in establishing overall objectives, are somewhat involved in marketing objectives, a little bit more involved in marketing strategies, and still more (but even then, only “somewhat”) involved with marketing tactics.
Executives also reported the highest level of involvement in planning or establishing marketing tactics. This result came as a surprise, because in high-functioning hierarchical organizations, tactical matters are typically delegated: leaders explain what or why something needs to be done, and trust the team to determine the best how.
Marketing Objectives
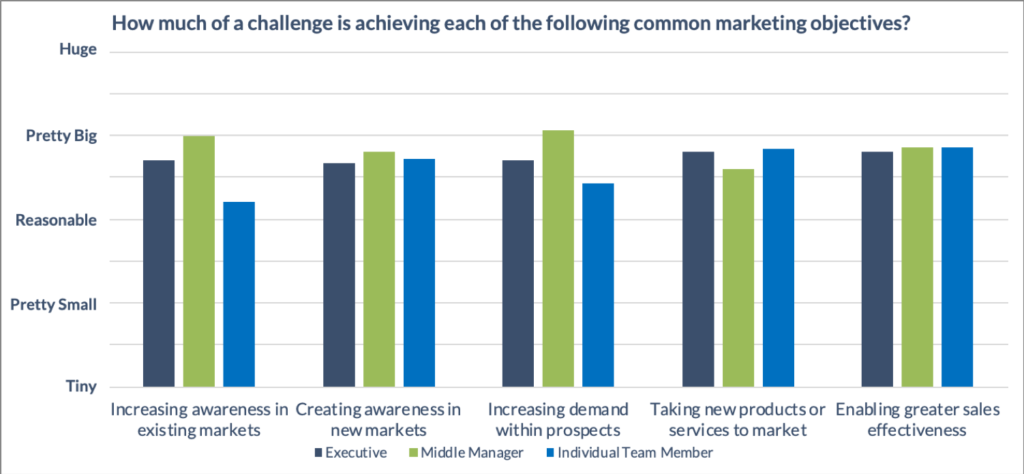
We asked survey participants to rate how much of a challenge it is to achieve a number of common marketing objectives; the results were extraordinarily consistent, both across objectives and across roles—on average, practically everyone rated everything as a “Reasonable”-to-“Pretty Big” challenge.
Really zooming into the data shows that Enabling greater sales effectiveness poses the biggest challenge, averaging very close to “Pretty Big” in our qualitative rating system. For whatever it’s worth, this challenge also showed the least variation between roles, so it seems that the respondents all agree on its severity.
In my company, marketing was started properly with hiring a very experienced and strategic, senior executive from the start. For this reason, objectives and strategy, the ‘true north star’ is clear. Thus, no time is wasted on things that do not help the strategy.
—Survey Respondent
The ‘least’ challenging (but still a “Reasonable” one) is Increasing awareness in existing markets. Interestingly, this challenge showed the greatest variation, with Middle Managers considering it to be “Pretty Big”, Individual Team Members rating it “Reasonable”, and Executives falling in the middle.
What can we take away from these results? Clearly, marketing objectives aren’t easy to achieve, so we need to choose our strategies and tactics with care to maintain focus.
Well-developed solution and use case messaging speak the market’s language and appeal to prospects’ desire to solve problems.
Keep in mind that use cases and success stories are closely related, but nevertheless distinct: while use cases explain what you can do, in theory, success stories showcase social proof of what you’ve already done in the real world.
Talkin’ Tactics
Much ink has been spilled, and many a pixel populated, on the subject of marketing tactics.
Tactics are important, obviously—they’re the part where stuff gets done—but they have to work for you, and not the other way around.
There is intense pressure to focus on tactics first (and only) and our tactical focus shifts on a daily and weekly basis as a result of not being anchored to any strategic direction.
—Survey Respondent
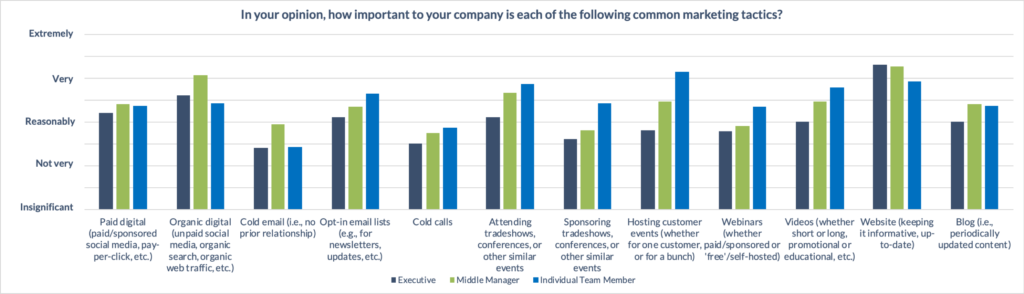
We wanted to understand which tactics are being employed by the region’s marketers, and we started by asking about the perceived importance of particular ones. Without belabouring the trivia, here are a few highlights:
- Executives see the company Website as the single most important marketing tactic—and by a pretty sizeable margin over the second place, and closely related, Organic digital
- Middle Managers are in close agreement with the execs, with the slight difference being that Middle Managers view Organic digital as almost on the same level as the Website
- Individual Team Members selected Hosting customer events as the most important tactic, albeit with the Website a very close second (a whisker ahead of Attending tradeshows, conferences, or other similar events)
- Website is the only tactic that, on average, was rated as being “Very” important
- All three groups rated Organic digital as being more important than Paid digital; for both, we need to keep in mind that getting digital marketing right is a necessary, but insufficient, part of the overall marketing puzzle—it needs to be accompanied by strong messaging and quality, purposeful content
- Videos are solidly middle-of-the-pack, averaging just a titch above being “Reasonably” important, and there’s rampant disagreement about just how important they are (or aren’t); Opt-in email lists and Blogs live in the same neighbourhood, with the latter exhibiting less variability
In The Digital Dilemma, we explain that digital marketing and strong content (which conveys a clear message) are two sides of the same coin—to be worthwhile, each needs the other.
We also asked participants to rate the level of investment that each tactic receives, and those responses gave us the data we needed to perform the ever-popular, insightful, and practical exercise of gap analysis.
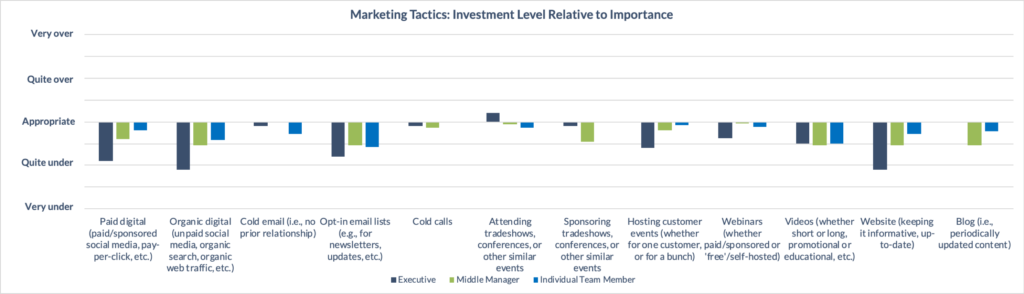
The most obvious outcome of simple arithmetic (the scale is consistent between the graphs) is that there’s almost complete agreement that we’re underinvesting in, well, everything. Sure, Executives think Attending tradeshows, conferences, or other similar events eats up too much investment, but that’s—literally—the only member of the over-investment club.
Notably, Executives have the strongest opinions about the magnitude of underinvestment, but that’s not a surprise—have you ever heard of an Executive who was satisfied with resourcing?
Averaging across all our respondents, Organic digital is perceived to have the largest gap between importance and investment level, followed closely by Opt-in email lists and Website. Videos sit alone in fourth; so, while they’re not seen as remarkably important, there’s broad agreement that they warrant more investment than they receive.
Many start-ups and scale-ups doom themselves with a well-intentioned, but dangerously stifling, overemphasis on marketing tactics.
Businesses have a very short runway to hit a trajectory of sustainable, long-term growth; when applied poorly, tactics create enormous, sneaky waste – in time, money, and effort.
We review some common mistakes and we explore some important warning signs in The Tyranny of Tactics: Is an over-focus on marketing tactics dooming your business?
Bumps in the Road
Establishing objectives, choosing strategies, and selecting tactics are only half the battle: next, the ‘real’ work needs to be done, and it’s rarely smooth sailing.
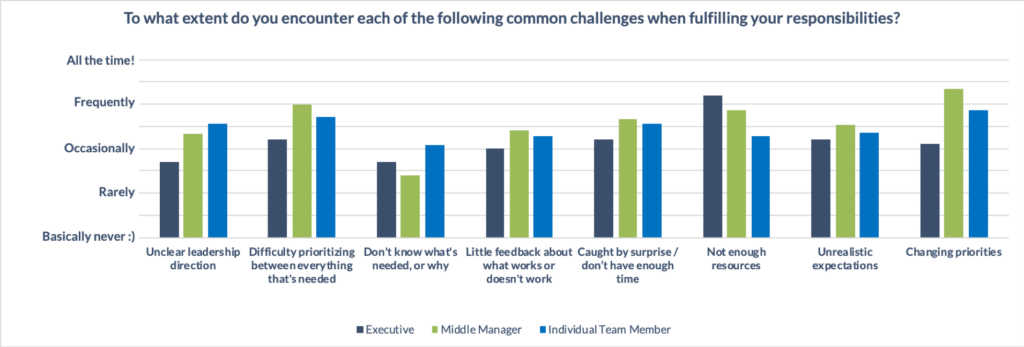
To understand what gets in the way, we asked respondents to what extent they encounter each of a number of common challenges.
On average, the challenge encountered most frequently is Changing priorities. This top ranking is largely the result of Middle Managers and Individual Team Members, both of whom suggested that they encounter the problem “Frequently”. Executives, however, aren’t in agreement: they ranked Changing priorities fifth on their list, with Not enough resources in the top spot, consistent with the previous gap analysis.
Across all three groups, Don’t know what’s needed, or why was ranked the least common challenge, being encountered somewhere between “Rarely” and “Occasionally”, depending upon whom you ask.
We currently don’t have a clear direction from the top-level down, making it difficult for marketing to align resources to drive results and measure effectiveness.
—Survey Respondent
Our respondents encounter the other six challenges with similar frequency, so we’ll just highlight a few interesting points:
- Individual Team Members face Unclear leadership direction more frequently than Middle Managers, who in turn face the challenge more frequently than Executives
- While Executives reported a lack of resources is the most frequent challenge, Middle Managers only ranked Not enough resources third overall
- Perhaps because they occupy the central layers of the corporate hierarchy, Middle Managers are challenged with Difficulty prioritizing between everything that’s needed more frequently than the folks above or below them on the ladder
Much Ado About Messaging
Messaging bridges the gap between your company and your audiences (e.g., customers, partners, investors, potential employees, etc.) by creating shared understanding.
Effective messaging grabs your targets’ attention, and quickly shows them the value of what you do, the meaningful differences in how you do it, and the importance of why you do it.
In short: your message matters.
A company without a story is usually a company without a strategy.
—Ben Horowitz, in The Hard Thing About Hard Things
Unfortunately, as companies grow—adding people, introducing new products and services, venturing into new markets—messaging usually suffers. Few organizations have a well-defined core message that’s delivered consistently across all media; this inconsistency creates confusion in the marketplace, most dangerously among potential customers (who crave clarity and certainty).
To better understand the state of messaging for the region’s technology companies, we asked survey participants three questions:
- In your opinion, how clear is your company’s message?
- In your opinion, how effective is your company’s message?
- In your opinion, how consistently is your company’s message conveyed?

The answers reveal two main insights:
- There’s general agreement about the state of messaging
- The state of messaging is OK, but not great
Collectively, respondents find their companies’ messages to be:
- Somewhere between “Somewhat” and “Very” clear
- “Somewhat” effective; and
- Delivered only “Somewhat” consistently
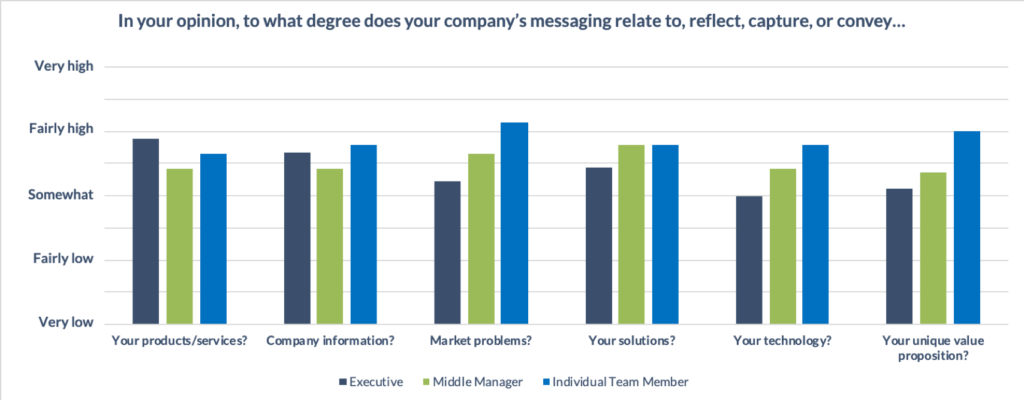
What goes into our messages? We asked survey participants to assess the degree to which their company’s messaging relates to, reflects, captures, or conveys each of six factors.
Inside-out thinking is the biggest barrier to success. Outside-in thinking is the best aid.
—Al Ries & Jack Trout, in Positioning
Market problems received the highest average score, narrowly beating out Your solutions, but we’re really splitting hairs here. Nevertheless, we interpret this result as a positive sign: taking the outside-in approach of talking about problems and solutions is generally more effective than the inside-out alternative of just shouting about our neat technology.
Still sticking with averages, Your products and Company information tied for the next spot, followed by Your unique value proposition and Your technology; again, though, the differences were very small.
Glancing at the visual results shows the curious characteristic that Executives tended to provide lower ratings than Middle Managers, who in turn provided lower ratings than Individual Team Contributors. Does more experience turn people into tougher critics?
Your stakeholders assemble their understanding of your brand from the bits of information they take in from a wide variety of sources.
—David Nour, in Co-Create
Sales Enablement, For the Win!
While some companies look at marketing solely as a lead generation machine, others take the more realistic and effective approach in which marketing is a strategic catalyst for the entire sales funnel—from discovery to deal closure.
We all know that B2B buyers complete 60% of the buying journey before we even learn about them. That stat is cited everywhere, so it must be true.
But…is it?
Learn the terrifying truth in Facts, Factoids, and the Most Over-Cited Statistic in B2B.
We all know that B2B buyers complete 60% of the buying journey before we even learn about them. That stat is cited everywhere, so it must be true.
But…is it?
Learn the terrifying truth in Facts, Factoids, and the Most Over-Cited Statistic in B2B.
Very broadly, there are four main mechanisms by which marketing contributes to increased sales effectiveness:
- Increase the absolute number of wins by creating more opportunities
- Increase the win rate by showing compelling value and overcoming buying barriers
- Shorten the time through the sales cycle by actively directing prospects and avoiding stalls (e.g., by rapidly addressing inquiries via self-service content or by having answers at-hand)
- Increase the average deal size by helping to sell more things (e.g., by showing solutions to more problems, by demonstrating positive ROI) and by limiting discounting (e.g., by proving meaningful differentiation)
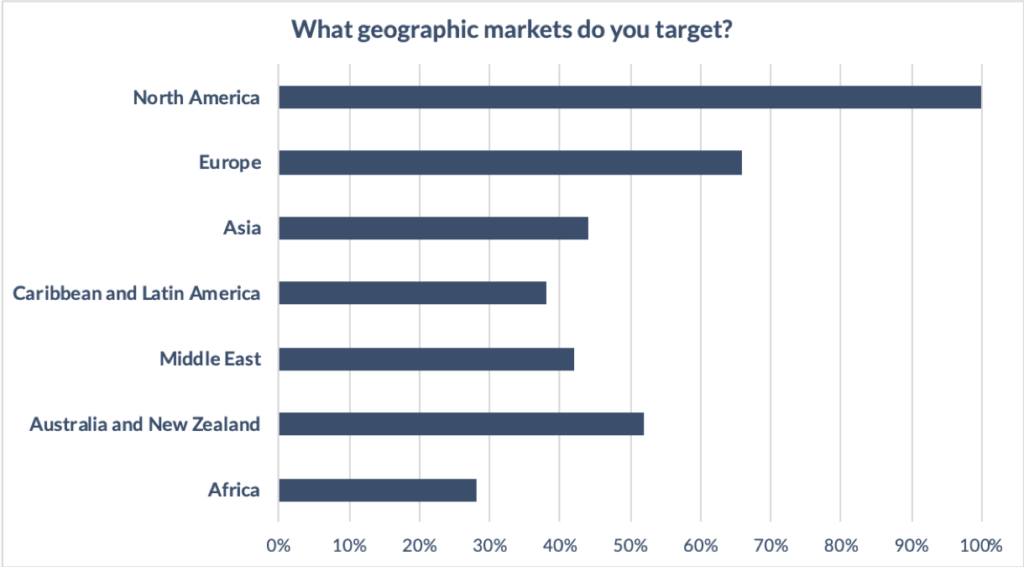
Waterloo Region’s tech companies have global reach, but definitely focus on North America and markets with strong currencies and friendly business environments (e.g., Europe, Australia and New Zealand).
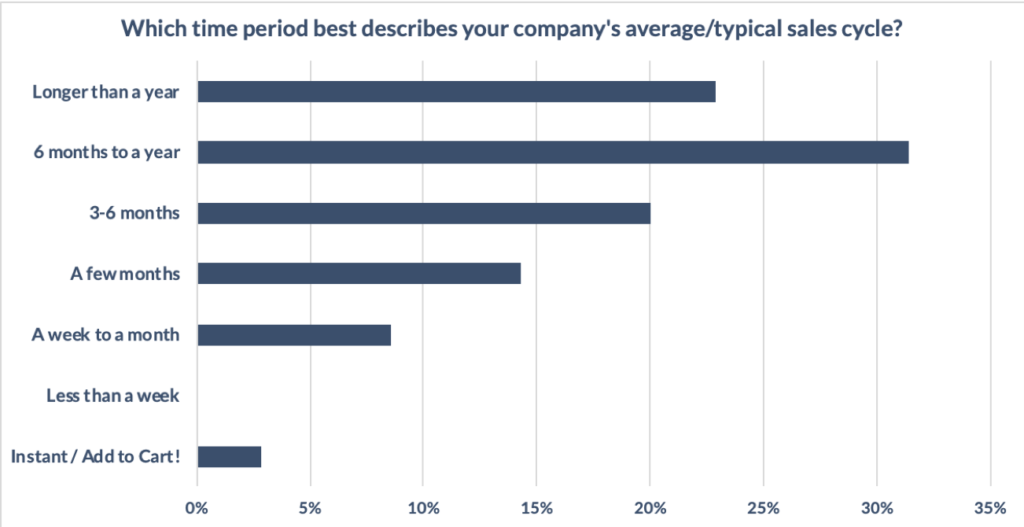
In terms of sales cycle, only about a quarter of survey respondents indicated that they turn a prospect into a customer in as little as a few months.
By contrast, more than half of respondents report that their sales cycle lasts between three months and a year, and almost a quarter experience the supreme joy of a sales cycle that drags on longer than 12 months. For the latter group, understanding budget cycles and navigating complex buying processes is no doubt a key requirement for success.
When we consider only extremely linear buying processes, we marketers oversimplify things for convenience.
For a new perspective, check out A Different Model of the Customer Experience Journey, and What it Means for Marketers.
Challenges
We asked participants to rate the significance of each of five common sales enablement challenges; respondents reported the most significant challenge to be Creating differentiation versus alternatives (e.g., competitors, “do nothing”, an in-house project, etc.).
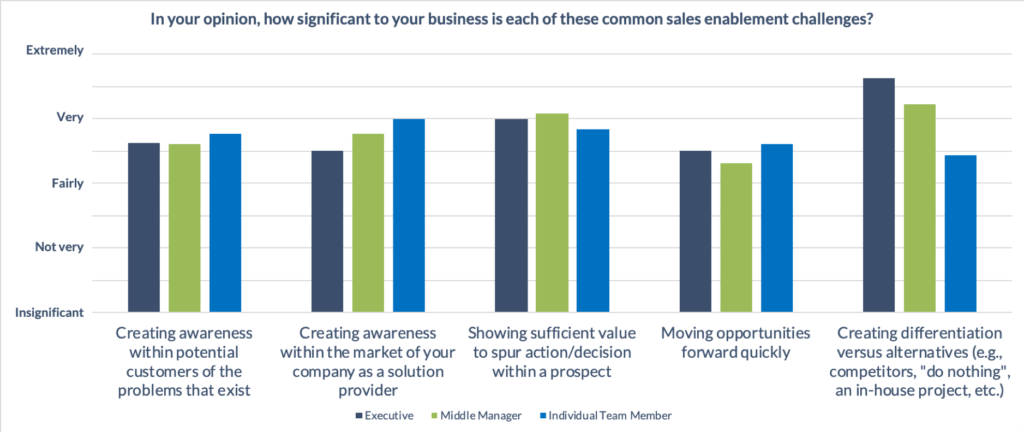
Interestingly, this challenge also showed the widest variation: Executives rated it the most significant by far; Middle Managers rated it the most significant, but only marginally so; Individual Team Members saw things differently, rating it least significant of the five options.
All three groups rated Showing sufficient value to spur action/decision within a prospect as the second-most significant challenge, and there was intergroup agreement as to the magnitude.
The sales team individually makes updates to the presentation materials shared with prospects during engagements so there’s a lack of continuity in the message shared from one engagement to another. There’s also no sales enablement training to ensure that the team understands updates to messaging or new feature capabilities.
—Survey Respondent
Creating awareness within the market of your company as a solution provider edged out the closely related Creating awareness within potential customers of the problems that exist, although in the former case there was some variation in perceived significance.
The least significant problem (but still somewhere between “Fairly” and “Very” significant) is Moving opportunities forward quickly. Tell that to the folks with the multi-year sales cycles!
What can we take away from these results? Two things…
First, the region’s companies need to invest in creating differentiation. If we assume that any prospect interested in purchasing a solution is going to research alternatives, then winning business requires showing unique advantages. Moreover, achieving meaningful differentiation demands a keen understanding of yourself, your competitors, and your customers: to learn what makes you different, you need to know both your own capabilities and those of your competitors; to be meaningful, those differences must relate to things that prospects value.
Second (and very closely related), the region’s companies need to get better at showing value. The main goal here is to get over the “so what?” barrier, characterized by a prospect who’s aware of a solution but doesn’t feel any particular urgency to move forward. Showing value creates that urgency by highlighting a positive return on effort and investment and by promising an idealized future—one in which many annoying, expensive problems are solved. In effect, it turns things around by showing the opportunity cost of failing to act.
Buying Barriers
Put simply, a buying barrier is anything that, from your prospect’s perspective, stops or slows their purchase (or adoption, in non-commercial relationships) of a solution.
Many companies go to great lengths to document the buying process (or its superset, the customer experience journey)—the codified, step-by-step process or sequence of milestones that a prospect follows.
Documenting the buying process is a good start, but it’s incomplete because doing so does little to capture the information needs, organizational blockades, and other complications that arise in the messiness of the real world. If you’ve structured your sales process around a squeaky-clean, perfect-world buying process, then you’re missing an enormous opportunity to improve results.
Few activities deliver as large and asymmetric a return as anticipating and addressing the barriers that prospects encounter when trying to give you money.
To learn about different buying barriers and how to overcome them, check out How to Boost Your Business by Overcoming Buying Barriers.
The good news is that investing just a little bit of time and effort to understand and address real-world buying barriers delivers wonderfully asymmetric returns, because doing so empowers you to develop high-impact messaging, effective content, and efficient sales processes. To maximize the effectiveness of this initiative, your content needs to proactively address known barriers; of course, the same pieces of content will also be used by the sales team to reactively respond to prospect inquiries.
With all of that in mind, we wondered how well the region’s technology marketers understand the messiness of the real world. The answer was a pretty consistent “Pretty well”.
Depending on your outlook, this result could be good or bad. We’re of the belief that few activities deliver as large and asymmetric a return as anticipating and addressing the barriers that prospects encounter when trying to give you money.

C-O-N-T-E-N-T (Find Out What it Means to…Us)
Content is the vehicle by which your messages get out into the market and in front of your target audiences, whether handed over by a salesperson, delivered in a presentation or webinar, downloaded from your website by an existing customer, or organically discovered by a new prospect searching for a solution to a problem.
If you don’t supply the information your prospects need to choose your company over the competition, they’ll get that data somewhere else, and the outcome might not be as favorable for you.
—Jay Baer, in Youtility
A comprehensive content portfolio helps you get a prospect’s attention, anticipates and meets their needs through their buying process, and arms your champions:
- Top-of-funnel content increases awareness and starts to build demand
- Middle-of-funnel content enables prospects to understand and evaluate your solutions
- Bottom-of-funnel content seals the deal and helps prospects justify their decisions
Ideally, your content anticipates and specifically addresses buying barriers at the precise stage in which they arise. Moreover, a great content library substantially improves your search relevance, raises the bar versus the competition, and is vital to scaling up your sales and marketing efforts efficiently.
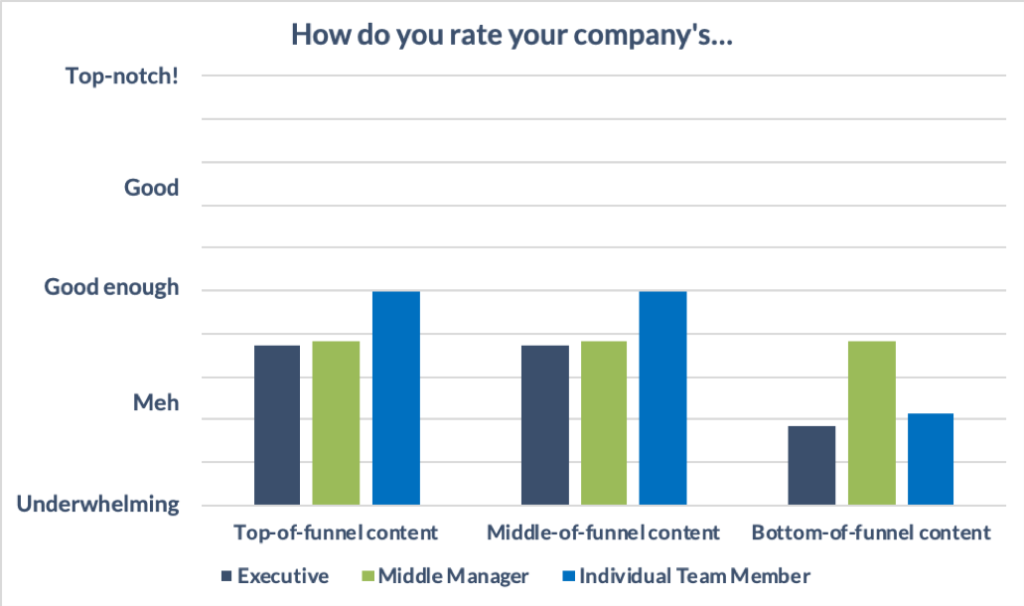
Unfortunately, when asked to rate their company’s content, our survey respondents indicated that there’s much to be desired:
- Both Top-of-funnel content and Middle-of-funnel content landed between “Meh” and “Good enough” (which, frankly, isn’t good enough)
- Even worse, Bottom-of-funnel content—the content that pushes deals over the finish line by demonstrating ROI, proving differentiation, etc.—averaged much lower, and that score was propped up by less pessimistic ratings from Middle Managers
Recall how an earlier section suggested that the region’s companies need to invest in creating differentiation and need to find more ways to show value? Well, that’s what bottom-of-funnel content does, so this gap is dangerous indeed.
Gettin’ Techie Wit It
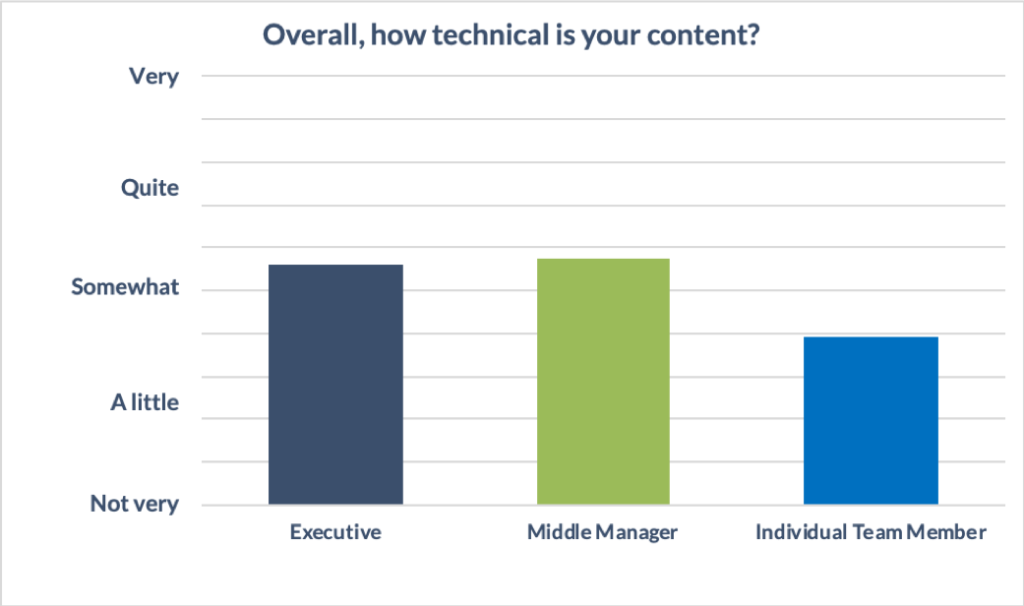
Bottom-of-funnel content tends to be more technical than its earlier-stage counterparts, because often its job is to explain how things actually work (e.g., to prove that a solution is viable, or to bolster differentiation, etc.). Does the low rating for Bottom-of-funnel content, indicate that Waterloo Region technology companies are challenged by technical content?
Indeed, we find that all three groups report that their content is, at best, only Somewhat technical. Of course, not all content should be technical—top-of-funnel content especially (except in rare cases)—but to secure wins most technology companies do eventually need to explain how their solutions work.
Unfortunately, in one of the survey’s clearest findings, respondents indicated that they simply do not have enough technical content. Executives were especially critical, with Individual Team Members only slightly less so; Middle Managers saw things in a slightly less negative light.

For what it’s worth, opinions were more positive when assessing the amount of marketing content, in general—but respondents still reported a large deficit (although it should be noted that Individual Team Members don’t fully agree).
Make no mistake, creating technical content requires a certain skillset, but too many companies fall into the trap of concluding either that it’s impossibly intractable or that they can live without it. As a tech company, you must be understood (or at least be perceived) by your prospects to have achieved meaningful technical differentiation, specifically relating to your unique ability to solve some urgent market problem.
When it comes time to sign the cheque, customers aren’t doing it because of your culture—they must believe in your technology.
Here’s our advice: start small, by focusing on a single topic that arises frequently (it’s probably a buying barrier).
See how, in Tackling Technical Topics.
Methodology
This project combines a top-down study of publicly available company information with a bottom-up survey of technology marketers. Essentially, we built two large data tables: one consisting of company information, and the other consisting of survey responses.
Information was collected between January 1st and February 2nd, 2019.
Company Information
We started by building a list of technology companies active in Canada, with a primary focus on the Waterloo Region. This list was initially populated through a variety of sources and mechanisms, including examination LinkedIn, Angel.co, job sites, news coverage, accelerator and incubator tenant lists both past and present (e.g., Communitech Rev, Accelerator Centre, Velocity, Laurier LaunchPad), personal contacts and network, and Google Maps (yep, just scrolling around looking for companies).
In parallel, we determined what information we needed to gather about each company.
With the initial list of hundreds of companies, we populated the data table using information gathered from, primarily, LinkedIn, Crunchbase, and company websites. As research progressed, we discovered more companies and added them to the set.
Unfortunately for us, but fortunately for the study, we kept thinking of more information to incorporate, so we had to go back through the whole company list several times to populate more columns. Such is life.
Once the data table was completely populated, we filtered by active companies with headquarters in the Waterloo Region (e.g., Waterloo, Kitchener, Cambridge, and smaller surrounding towns). This smaller list – which still contained hundreds of companies – served as our final company dataset.
Technology Marketer Survey
From January 8th through January 25th, we conducted a 44-question survey (through SurveyMonkey) open to technology marketers in the Waterloo Region. The survey was promoted and shared (and re-shared, thanks!) through the usual channels of LinkedIn and Twitter.
Upon survey closure, we filtered out the handful of results that came from respondents outside of the Waterloo Region, which still left us with high double-digit responses totalling thousands of data-points.
Limitations and Considerations
While we did our best to ensure a comprehensive and representative dataset, there are some definite limitations and subjective considerations. In particular:
- One key subjective consideration is: where do we draw the line between a technology company and a company that simply uses technology? We tried our best to apply a consistent ‘test’ that assessed whether technology was an output or major defining characteristic of a company, or merely a tool. This distinction meant that companies like Sun Life and Manulife are omitted, as are many agencies and consultants who work with the tech industry.
- Our visibility into the long tail of tiny and small (say, fewer than 5 employees) companies is limited: they’re less likely to post jobs, to have dedicated office space, to be part of our contact network, to be in the news, etc. The exception is companies who attended or attend a local accelerator/incubator, as those programs keep and post detailed records. It should be noted that the main impact of this data gap is analysis of company counts; employee counts are only negligibly impacted, due to the relatively small contribution of small companies, even collectively.
- Are Business Development Representatives (BDRs) marketers? Some companies say yes, some say no. In our manual research, we excluded BDRs from the marketer count. We can only assume that some survey respondents included them. For what it’s worth, we did include the collection of “Demand”-related roles.
LinkedIn is a useful, but imperfect, tool, only as complete and accurate as its membership allows. Consequently, wherever possible we took care to sanity-check and cross-check our research.
To verify the accuracy of our estimates regarding the number of employees in a company, and the number of marketing employees in a company, we performed at least four types of validation.
- First, for a handful of randomly selected companies we manually went through each and every employee and compared against the active employee list. What we found was that the number of people who were false positives (i.e., their LinkedIn profile showed they were still at Company X even though they’d moved on) was approximately offset by the number of people who were false negatives (i.e., they worked at Company X but hadn’t yet updated their profile).
- Second, wherever possible we compared the survey respondents’ estimates of employee and marketer count to those that we discovered through LinkedIn; we were pleased to find that these counts were in very close agreement.
- Third, in many cases we reached out to personal contacts to verify our estimates and findings.
- Fourth, because marketing titles change over time, and we didn’t want to get left behind, we populated our search parameters based upon we analysis of the job titles submitted in our survey responses.
Additionally, LinkedIn’s category list and the limitation of one category per company are, to put it mildly, dumb. Moreover, many companies have made the decision to base their category upon their technology rather than the market they target or the solution they provide. In essence, they’re choosing a category based on how they do something rather than what they do, or for whom. We disagree with this approach. To provide a more accurate assessment of the industries in which our tech companies participate, we manually reviewed and – where prudent – assigned a more suitable category (but still based on LinkedIn’s list). For companies that pursue multiple markets, we examined their own messaging and then made a judgment call about their primary market.
We also cross-referenced and verified details like company founding date, headquarter location, etc.
In summary: is the study perfect? No. Did we take care to make it as accurate and representative as possible? Yes.
We’d of course welcome suggestions for how to improve our methodology going forward.