
- 19
- November
Facts, Factoids, and the Most Over-Cited Statistic in B2B
“People can come up with statistics to prove anything. Forfty percent of people know that.”—H. J. Simpson
If you’re even remotely involved with B2B marketing, then you’ve almost certainly seen the oft-cited B2B statistic that 60 percent of a customer’s buying decision is made before you even learn they’re interested. It shows up everywhere…I’ve personally come across it in at least half a dozen books, and literally* dozens of articles and posts.
*and I use literally correctly
TL;DR
As commonly used, this B2B statistic is clumsily misrepresentative, ignorantly misleading, or deliberately manipulative.
Don’t have time for my little research project? OK, here are the main points:
- As commonly used, this B2B statistic is clumsily misrepresentative, ignorantly misleading, or deliberately manipulative
- Buying behavior varies enormously: there’s no substitute for genuinely learning about the buying behavior, process, barriers, etc. of your own target markets
- The idea of a linear buying process might be a bit outdated, especially if your business depends upon expansion and renewals
- The benefits of creating and maintaining a useful, valuable, content library are many in type and large in magnitude
- The actual report/study from which the B2B statistic is drawn is worth your time to read, as it’s really a good level-setter with some practical guidance and considerations for digital marketing
The Rise of a Factoid
How common is the stat? Here are five examples/citations that spring to mind, in this instant:
- Youtility, by Jay Baer (p57-58): “Sixty percent of the decision is made before the prospect identifies himself. Sixty percent of the decision is made before a call, or an email, or an entry into your lead tracking database. Customers are ninjas now. They are stealthily evaluating you right under your nose.”
- The End of Solution Sales (HBR): “…customers completed, on average, nearly 60% of a typical purchasing decision—researching solutions, ranking options, setting requirements, benchmarking pricing, and so on—before even having a conversation with a supplier”
- Making the Consensus Sale (HBR): “…customers are, on average, … 57% of the way through the process before they engage with supplier sales reps.”
- Co-Create, by David Nour (p85): “For the past several years, there has been a bit of conventional wisdom circulating that the average B2B buyer is 57 percent of the way through the buying journey before ever engaging with a vendor sales rep.”
- Last week, at a content strategy peer-to-peer, one of the participants said that, “We all know that most of the research is done before we even know the prospect” as a lead-in to a more general point.
In fact, this B2B statistic is so ubiquitous that it almost always appears without attribution, citation, or explanation; it’s just common knowledge at this point.
That’s not surprising, because:
- it makes intuitive sense, so it goes unchallenged, and
- it’s a marketing professional’s dream!
This B2B statistic is proof-positive that your job—whether content creation, market research, marketing automation, and so on—has meaning and importance. It’s just so damned convenient to believe.
Moreover, the stat has grown and morphed over time: I’ve seen it applied outside of B2B contexts, and I’ve seen it stretch, from “57 percent”, to “almost 60 percent”, to “almost two-thirds”, to “nearly 70 percent”, which of course leads to “almost three-quarters”; at this rate, buyers will soon have researched and bought the product before it’s even available, almost like the instant cassettes from Spaceballs*.
*They were available in stores before the movie was finished
But the thing about common knowledge is that it’s often outright wrong. Or, at the very least, it’s somewhat mistaken or misleading.
Very well…where do I begin?
“There are three kinds of lies: lies, damned lies, and statistics”—popularized by Mark Twain and attributed to Benjamin Disraeli
Now, it’s a bit of an understatement to say that I have some experience with stats, both academically and professionally. I also have an endless interest in marketing. Additionally, I have zero tolerance for BS, whether accidental or otherwise…so I decided to do a bit of sleuthing.
A few minutes later, I’d tracked the 57 percent B2B statistic to its source: it comes from a study conducted by The Corporate Executive Board Company (CEB Global, now a subsidiary of Gartner), in partnership with Google (yes, that Google): The Digital Evolution in B2B Marketing.
On the second page, there’s a call-out that says, “On average, customers progress nearly 60% of the way through the purchase decision-making process before engaging a sales rep.”
This snippet is one stand-out finding from a survey of B2B professionals, and rounds up from a finding that, on average, a “customer’s first engagement with sales” comes when the customer is 57 percent of the way through the purchase process.

A second figure shines a bit more light on the underlying data by revealing the distribution of the survey responses.
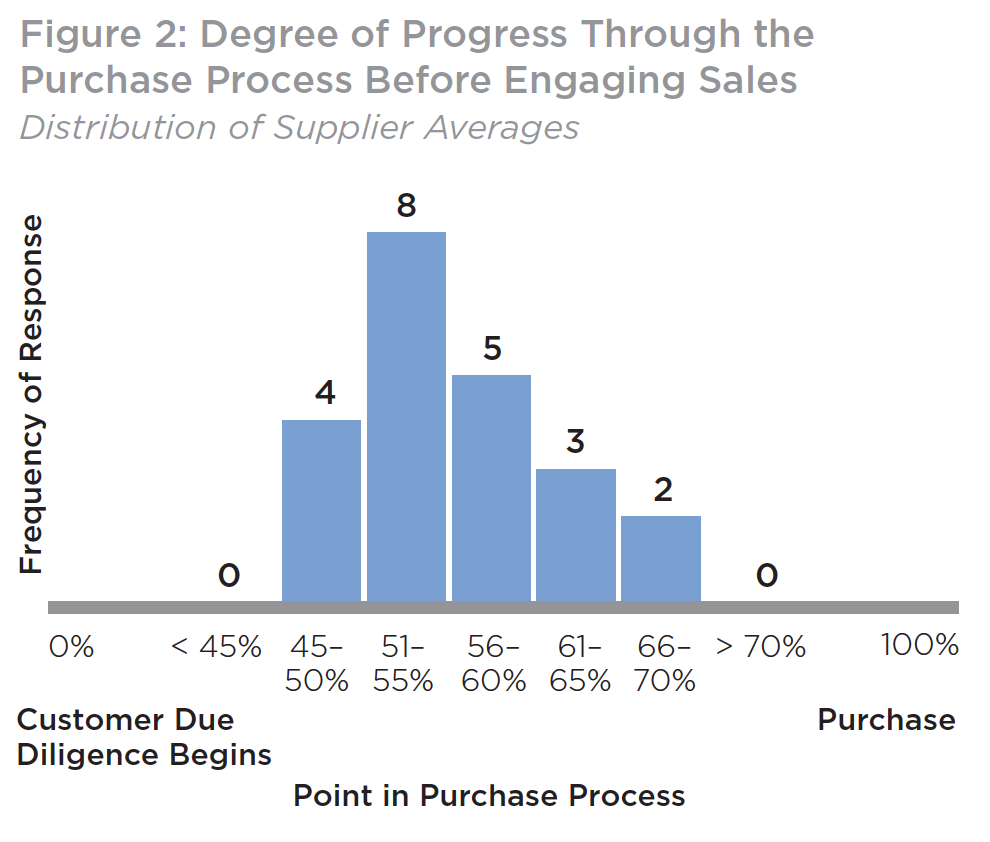
When presented in a histogram format, we can see that there’s actually quite a bit of variation—although, perhaps surprisingly, there aren’t any responses below 45 percent, which seems just a titch suspicious.
Also, what the heck: n = 22?? You’re telling me that the most-cited statistic in all of B2B marketing is based on a survey of 22 participants?
Yes and no.
Here’s what the report says: “CEB Marketing Leadership Council surveyed more than 1,500 customer contacts (decision makers and influencers in a recent major business purchase) for 22 large B2B organizations (spanning all major NAICS categories and 10 industries).”
OK, 1,500 suggests a bit more reliability than 22…but is it really?
“Increasing sample size reduces error only if the sample is unbiased.” – Richard E. Nisbett
To quote from Mindware, by Richard E. Nisbett (p126): “Increasing sample size reduces error only if the sample is unbiased.” That’s a good thing to remember, especially if you’re getting into analytic decision-making or forecasting, and it largely explains why some pollsters have terrible track records, and others—the ones who take huge steps to ensure diverse samples—are reliable (19 times out of 20, with a margin of error of +/- 3%).
Given that those 1,500 contacts come from only 22 organizations, I’m inclined to err more on the side of the 22 and less on the side of the 1,500. That is, I seriously question the validity of extending this study’s findings across “all major NAICS categories”, as the study implies.
Why? Well, I expect that the buyers targeted by those 22 organizations have more than a few things in common, so the survey will be enormously (but unintentionally) biased. What about buyers who buy from smaller organizations? What about the buyers targeted by B2B organizations who aren’t part of the CEB contact list?
Also, by summarizing at the organization-level before aggregating, we lost resolution. Recall how the histogram doesn’t have any data-points below 45%: that’s the result of how the data was aggregated. The survey responses were aggregated at the organization level, organization #1 = 53%, organization #2 = 68%, and so on, rather than combining all 1,500 individual survey responses results into a much richer distribution (this approach would’ve had its own issues). Additionally, the survey seemingly gave equal weight to all 22 organizations, but we don’t know if that’s reasonable; for instance, maybe one organization accounted for 300 survey responses and another only 30—should they be treated equally in the aggregation?
Only by understanding the survey’s structure can we reasonably interpret the famous result.
What went wrong?
“Round numbers are always false.”—Samuel Johnson
Basically, people saw a convenient conclusion (a “striking finding”, in the words of the study’s authors), backed up by a ‘fact’ in the form of a number, and ran with it.
Even folks who knew better sometimes got caught up in the excitement. Recall that quote, above, from Co-Create; well, here’s what came right after: “However, this magical 57 percent figure, while accurate, represents the average aggregate trend of all buyer behavior. The key to not mistaking factoids for actual facts is knowing your buyer.”
Nice. Mr. Nour has introduced some sense into the discussion. He’s recognized that the B2B statistic is an oversimplified representation of a complex situation, just like Malcolm Gladwell’s popularization of the 10,000 hours rule of thumb significantly oversimplifies Anders Ericsson’s actual research findings.
So far so good, except on p133 of Co-Create, Nour states confidently that, “Recent research tells us that consumers are doing 57 percent of their due diligence before they ever contact a company.”
Whoops.
OK, Get to the Point
The implication—that you should produce quality, valuable content to aid with your prospects’ research and decision-making—is completely valid.
It’s fair to say that yes, your buyers are likely doing some research before they pop onto your radar. But it’s not fair to conclude that the magical 57% B2B statistic applies to your market.
However, the implication—that you should produce quality, valuable content to aid with your prospects’ research and decision-making—is completely valid. In Nour’s words, “What can you do to create inbound inquiries? What can your organization do to invest in ways to be more visible, more ‘findable’ by individuals? This is the ideal opportunity for you to create compelling content, highly personalized and relevant to your target audience. Help them learn and discover new approaches, challenge their assumptions, but above all, lend a hand in their discovery process.”
Moreover, it really is worth your time to understand the buying behaviors of your prospects, rather than reading some articles online and assuming that whatever conclusions or tactics emerge will serve you well.
Maybe some broad canvasing of ideas is OK as a starting point, absent any other experience or knowledge on your team; but as soon as you’re up-and-running, you should speak with your prospects to understand their behavior, and you should employ whatever tools are at your disposal to actually observe and measure their behavior.
Another thing to keep in mind is that the 57% figure—even if it was legit, valid, representative, etc.—is limited to a very linear, first-purchase buying process. So it doesn’t really apply to expansions, renewals, and other real-world considerations.
The report that birthed the 57% figure is actually really good, and should be required reading for anyone in marketing leadership. It’s not the report’s fault that a single B2B statistic has taken on a life of its own.
Additionally, I want to make it clear that the report that birthed the 57% figure is actually really good, and, in my opinion, should be required reading for anyone in marketing leadership (whether CMO-level leadership or functional/departmental leadership). It’s a great summary of some of the strategic, tactical, and organizational (e.g., structure, procedural) issues that organizations face while implementing digital marketing.
Hey, it’s not the report’s fault that a single B2B statistic has taken on a life of its own.
How to Lie with Statistics
It ain’t what you don’t know that gets you into trouble. It’s what you know for sure that just ain’t so.—(also probably wrongly attributed to) Mark Twain
For all the keeners out there who want to learn how to quickly assess the veracity of a stat (without needing any math!), I recommend reading the useful, funny, and short How to Lie with Statistics, by Darrell Huff.
Published in 1954, it remains as relevant today as it was in the post-World War II years; after all, politicians, advertisers, employers, and many other folks have today the same incentives to deliberately mislead as they did back then.
After training us on how to produce wonderful statistical lies, Huff evens-out his karma by concluding the book with a chapter called How to Talk Back to a Statistic, and in it he arms us with some questions that might make our lives easier. In his words, “Not all the statistical information that you may come upon can be tested with the sureness of chemical analysis or of what goes on in an assayer’s laboratory. But you can prod the stuff with five simple questions, and by finding the answers avoid learning a lot that isn’t so.” (p124)
Question #1: Who says so?
“About the first thing to look for is bias—the laboratory with something to prove for the sake of a theory, or a reputation, or a fee; the newspaper whose aim is a good story; labor or management with a wage level at stake.”
Huff advises us to look out for conscious bias; that is, a bias that is deliberate and manifests in outright deception, selective presentation of information, suppression of inconvenient data, and so on. Importantly, he also warns against unconscious bias, suggesting that “it is often more dangerous” (p125). An individual’s generally rosy outlook might cause them to inadvertently overlook negative data, for instance. Accidental or not, the impact is the same as a conscious decision.
Huff spends quite a bit of space outlining another common tactic, use of what he calls “the OK name” (p125). By this, he means to watch out for any stat that purportedly comes from an institute with a fancy or recognizable name. But surely data from such an organization is good, you might be thinking. Huff doesn’t disagree. Rather, he warns us to watch out for cases where a stat might originally come from an OK name, but the presentation of the fact twists and turns and deviates from the original study or finding—the result being that the reader attributes to the organization something that was not actually found or intended. In other words, Harvard might have found X, but the newspaper article might have wandered far off course in order to sensationalize; the poor reader thinks, “Wow, Harvard! I will now suppress all skepticism.”
Looking back on this 57% episode, we see exactly what Huff was talking about: this particular B2B statistic came from CEM and Google, both of whom have some skin in the digital marketing game, and the stat took on a life of its own far beyond what the report’s authors likely intended or foresaw.
Question #2: How does he know?
“Watch out for evidence of a biased sample, one that has been selected improperly…Ask the question: is the sample large enough to permit any reliable conclusion?”
In this section, Huff wants us to learn to ask how data was gathered. Was it a survey? A random sample? A mathematical calculation? He tells us, “Watch out for evidence of a biased sample, one that has been selected improperly…Ask the question: is the sample large enough to permit any reliable conclusion? Similarly with a reported correlation: is it big enough to mean anything?” (p128)
You might be wondering how, as normal people, we can determine if a sample is large enough, or if a correlation is significant. While there’s no perfect mechanism available most of the time, Huff’s confident that we will do alright: “You cannot, as a casual reader, apply tests of significance or come to exact conclusions as to the adequacy of a sample. On a good many of the things you see reported, however, you will be able to tell at a glance—a good long glance, perhaps—that there just weren’t enough cases to convince any reasoning person of anything.” (p128)
What did we see when we peeled back a single layer to uncover the origin of the 57% stat? That it was based on a survey with only 22 distinct samples.
Question #3: What’s missing?
In a nutshell, Huff wants us to find out what’s been omitted from the presentation of the statistic. While there’s no single way of finding out, there are a number of things that are commonly and conveniently forgotten, and all are red flags sufficiently large to cast a shadow of suspicion:
- Information about sample sizes
- When dealing with a correlation, a lack of a reliability figure (standard error or probable error)
- When dealing with an average, an explanation of what type: mean, median, mode
- Related figures that would make a comparison possible
- When dealing with an index, information about the base
- Percentages without raw figures
- When dealing with an average, something to indicate the distribution
- In any situation, an explanation of the measurement technique and consideration of how that technique might have changed over time (extremely useful when examining statistics around diagnosis rates for diseases over time)
No source with nothing to hide should balk at being asked for any of the above.
What do we encounter when we see the 57% figure ‘in the wild’? Just a statement of fact, with little or no explanation (or, in some cases, a mistaken or misleading explanation).
Question #4: Did somebody change the subject?
In Huff’s words, “When assaying a statistic, watch out for a switch somewhere between the raw figure and the conclusion. One thing is all too often reported as another.” (p133)
For instance, more reported cases of crime are not the same thing as more incidences of crime. Perhaps the mechanism of reporting was made easier. Consider as well the difference between the amount of money people donate to charity per year, and they amount that people say they donate.
Some other common tricks include: comparing apples to oranges, stating cause and effect conclusively when dealing with a correlation, and any claims about being first in some category.
In our case, the original survey will have asked respondents how far into a buying process they were before they engaged with a sales rep, so it’s entirely dependent upon subjective interpretation of the question and the accuracy of memory. Objective measurement might yield a different conclusion.
Question #5: Does it make sense?
“Many a statistic is false on its face. It gets by only because the magic of numbers brings about a suspension of common sense.”
Maybe Huff could have led with this one and saved us a lot of work, as he readily admits that “‘Does it make sense?’ will often cut a statistic down to size when the whole rigamarole is based on an unproved assumption.” (p139)
As powerful as this simple question is, all too many of us fail to ask it. We suspend our disbelief because of an OK name, or we see some incredible precision in a percentage and then assign some untouchable aura to the whole conclusion.
But we should stop being so gullible and polite! As Huff tells us plainly, “Many a statistic is false on its face. It gets by only because the magic of numbers brings about a suspension of common sense.” (p140)
Extreme precision and anything involving extrapolation (shout out to anyone who’s read Confessions of an Economic Hitman) are other red flags billowing in the wind: just stop and ask if it’s reasonable to know something nebulous to that degree of precision, or to extrapolate a trend (that itself might be based on questionable data) for a long period.
For our stat, does it really make sense that something as rich, complex, and varied as B2B buying behavior—across the entire range of businesses and industry, no less—can be captured by a single number? No, of course it doesn’t. But the magic of numbers and the sheer damn convenience of the conclusion produce a very strong force for propagation.
Final Remarks
And there we have it—five simple questions to ask, in place of statistical calculations, to help us challenge all the advertisers, politicians, employers, think-tanks, and scienticians out there who are trying to pull the wool over our eyes with the magic of numbers. Seriously, try applying those for even just a day or two, each time you’re presented with a stat, and you’ll likely increase your level of skepticism and be the better for it.
But hey, if five questions are too many to remember, then you can just heed Samuel Johnson’s advice.
–
Header/Featured photo credit: João Silas on Unsplash