
- 05
- February
Growing Pains
While the region’s companies scale pretty much as expected up to a point – about 100 to 150 employees – they appear to run into a real problem crossing particular thresholds: at roughly the 200-, 250-, 500-, and 1000-employee marks.
In preparing the Waterloo Region Technology Marketing Spotlight, I gathered a great deal of data. In crunching that data, I’ve come to suspect that Waterloo Region’s tech companies have a scaling problem: they’re not as big as they should be.
I don’t mean that naively, or hopefully; instead, I mean it mathematically.
A Quick Backgrounder…
First, a little bit of background about Zipf’s law (quoting from the excellent Scale, by Geoffrey West, p311):
Zipf’s law owes its name to the Harvard linguist George Kingsley Zipf, who popularized it through his fascinating book Human Behavior and the Principle of Least Effort, published in 1949. He first enunciated his law in 1935…for the frequency of word use in languages. As originally stated, the law says that the frequency of occurrence of any word in a corpus of written text such as all of Shakespeare’s plays, the Bible, or even this book is inversely proportional to its rank in the frequency table.
Even more mystifying is that this same law is valid across an astonishing array of examples, including the rank size distributions of ships, trees, sand particles, meteorites, oil fields, file sizes of Internet traffic, and many more.
West goes on to demonstrate that Zipf’s law applies to the distribution of company sizes, revenue – and really, basically anything that can be counted – and includes a figure showing that the rank-size distribution of companies in the United States is in near perfect conformance to mathematical prediction.
The Zipf Test
I thought it’d be fun (I’m a nerd), and potentially instructive, to see how well the Waterloo Region’s tech companies fit the expected distribution, so I crunched some numbers.
Note: the companies in this dataset are all headquartered in the Waterloo Region, although I don’t mean to imply that all the employees are based here.
The figure below shows the region’s tech companies plotted by size and rank against logarithmic axes, with an overlay of the expected plot derived from applying Zipf’s law with OpenText as the largest company.

OK, what can we see?
First, if we look at the top-left, it’s clear that my dataset under-represents tiny companies (unfortunately it’s difficult to track down all the region’s one- and two-person companies); fortunately, that’s unimportant for the conclusions of both this post and the larger study.
Much more importantly, we can see that while the region’s companies scale pretty much as expected up to a point – about 100 to 150 employees – they appear to run into a real problem crossing particular thresholds: at roughly the 200-, 250-, 500-, and 1000-employee marks. These points are shown in the graph by the sequences of descending blue dots that should, in theory, trace along the grey line.
It’s actually really neat how clearly these growth plateaus are revealed in the plot. They seem too blatant to be simply statistical anomalies, and the dataset is very good for companies this large…so I can only conclude that the stalls are real.
Zipf’s law suggests that, with OpenText as the largest company in the dataset (somewhere around 11,000 employees), we should expect to see a company at about 4,000 (BlackBerry obliges), then one about 2,250 (nope), and one at roughly 1,500 (nope), and then one at nearly 1,100 (nope), and by now you probably see the problem.
And don’t let the log scale fool you – we’re not talking minor deviations: Zipf’s law suggests that, with OpenText as the largest company in the dataset (somewhere around 11,000 employees), we should expect to see a company at about 4,000 (BlackBerry obliges), then one at about 2,250 (nope), and one at roughly 1,500 (nope), followed by one at nearly 1,100 (nope), and by now you probably see the problem.
What happens at those milestones to slow down growth? Why aren’t our scale-ups scaling up as much as expected? I have some ideas, but I’d need to do more research, so there’s not much point speculating (sorry).
I suppose it’s possible that we just need a larger dataset, perhaps all companies in the region? But still, those little tail-offs seem mighty suspicious.
OK, let’s have more fun with data.
The Pareto Test
Let’s kick off this section by continuing that excerpt from Scale.
In economics, Zipf’s law actually predates Zipf. Much earlier it had been discovered by the influential Italian economist Vilfredo Pareto, who expressed it as a frequency distribution fo incomes in a population rather than in terms of their ranking… Pareto’s law, or the Pareto principle, has often been loosely stated in the form of the so-called 80/20 rule, in which the richest 20 percent of a population controls 80 percent of the total income, which is approximately true for the entire globe. Similarly, roughly 80 percent of a company’s profits come from 20 percent of its customers, as do 80 percent of its complaints.
So if we plot the cumulative employee distribution across the region’s technology companies, then we should expect to see that 80% of employees work at the largest 20% of companies.
Alright then, let’s see what we’ve got…
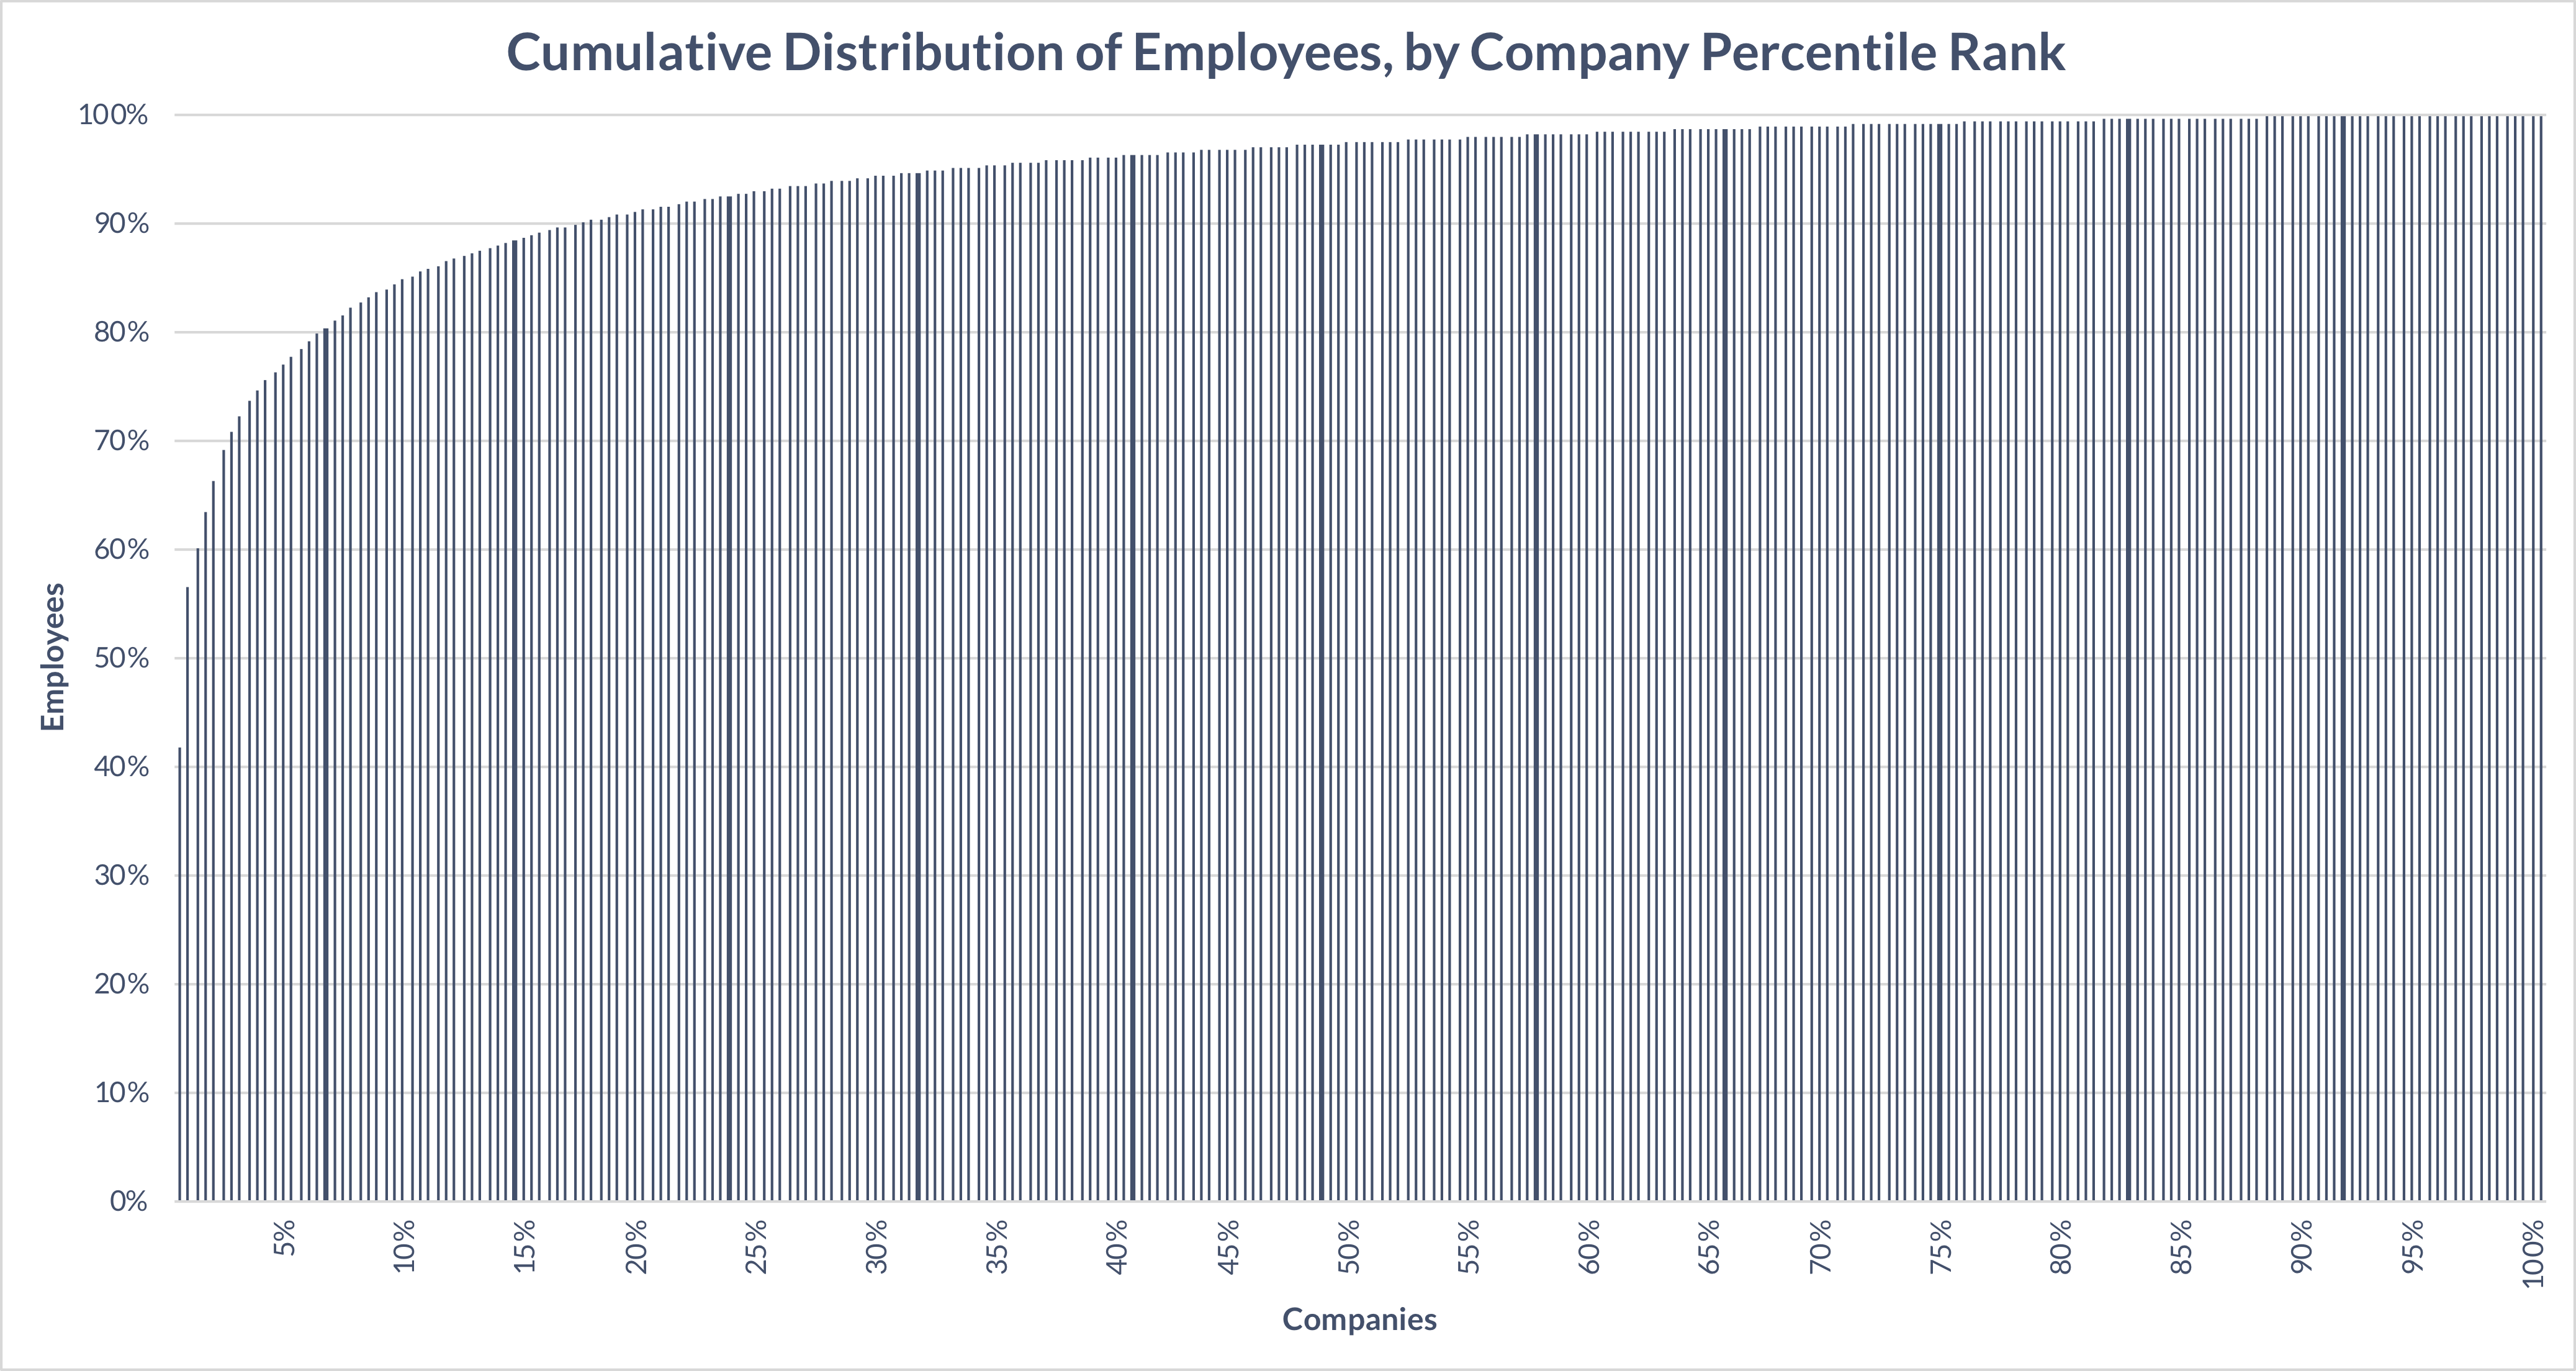
Uh oh…at the 20% company mark, we’re at 91% of employees. That’s very top-heavy.
For fun, let’s see what happens if we take OpenText and BlackBerry out of the picture…

Wow! With that, um, ‘slight’ adjustment, the largest 20% of companies account for 80.12% of employees. Toss in all the missing tiny companies, and we’re basically right on 80%.
Or, even better, keep OpenText and BlackBerry in, and magically scale up our mid-sized companies, and we’ll be legitimately right on 80/20.
Conclusions
If we want the region and its workers to benefit from being home to more, bigger companies, then we should figure out what factor or factors are getting in the way of company growth.
The data reveals at least two major conclusions.
First, OpenText and BlackBerry are real outliers in the region, in terms of employee count; they’re just thaaat much bigger than everyone else.
Second our scale-ups appear to hit real growth challenges as they approach the 200-, 250-, 500-, and 1000-employee mark. I’m not suggesting the employee count is the ultimate cause here, but it’s a proxy for something like revenue, organizational complexity, market saturation, or some other factor that’s at play.
If we want the region and its workers to benefit from being home to more, bigger companies, then we should figure out what factor or factors are getting in the way of company growth.
And on that note for folks interested in the dynamics of company growth, I strongly recommend reading Chapter 9 (“Toward a Science of Companies”) of Scale; for folks especially interested in the universal laws of growth, innovation, sustainability, and the pace of life of organisms, cities, economies, and companies, I recommend you read the whole book – it’s long and thorough, but oh-so-utterly fascinating.

—
Header/Featured image credit: Alessia Cocconi on Unsplash